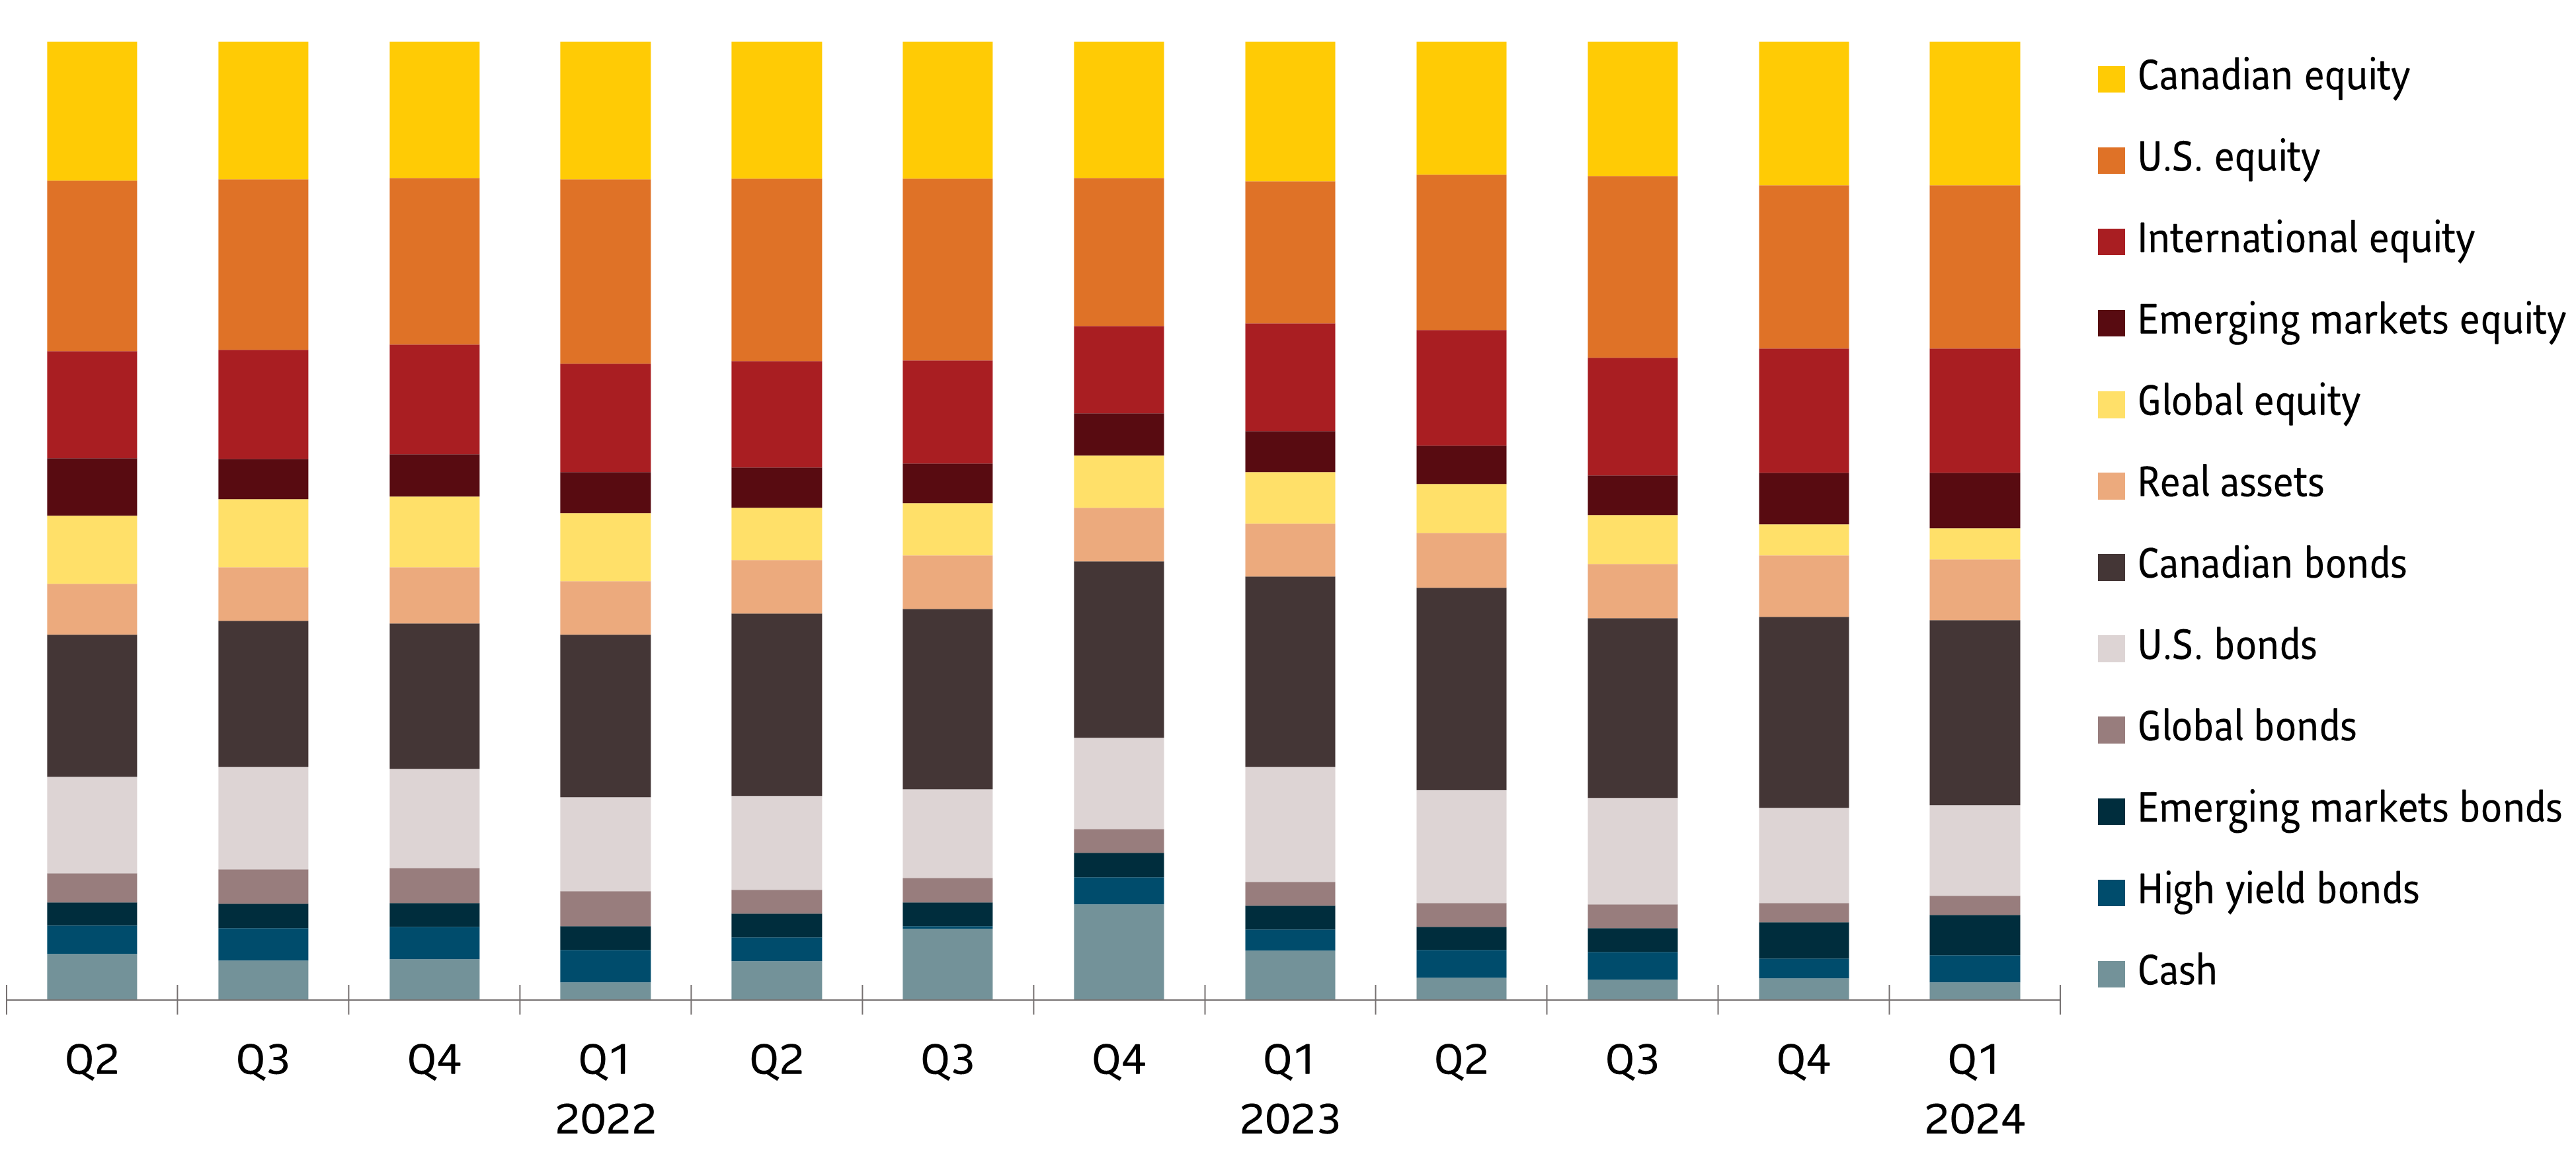
Key tactical changes
- Modestly overweight equity: We are largely neutral across developed market equities. We are optimistic about emerging market equities because of attractive valuations, especially in China.
- Underweight Canadian investment grade (IG) bonds: We trimmed our Canadian IG bond exposure to reduce overall duration of our bond portfolios.
- Trimmed underweight position in global high-yield (HY) bonds: We are currently neutral to this asset class as major sectors such as energy, face less reinvestment risk. A better global growth outlook and higher commodity prices have also improved the prospects for HY issuers.
Major equity markets across the globe posted robust performance in Q1 2024. The benchmark S&P 500 Index rose 10% and hit 22 new all-time highs during the period. Benchmark indexes in Canada and Europe also posted high-single digit gains. Much of the optimism for stocks came from expectations that inflation across developed markets was falling to a target rate of 2% and that interest rate cuts from central banks were around the corner. In January 2024, markets expected the U.S. Federal Reserve to cut interest rates by 150 basis points (bps).
But during Q1 2024, record jobs data and sticky inflation clouded the outlook for rapid interest rate cut expectations. U.S. CPI came above expectations for three straight months in Q1 2024 and held above the 3% level in March. On the other hand, job gains blew past expectations in the first quarter. By April, both these factors forced the market to reset its interest rate cut expectations to just two or three 25 bps cuts in 2024. While we believed that equity markets’ expectations for six interest rate cuts was too optimistic, we agree with bond markets that have a more nuanced view of the magnitude of interest rate cuts.
The 10-year U.S. Treasury touched 4.5% in early April, the highest level since November 2023. We think this reflects the U.S. economy’s resilience and that rate decreases could be delayed to the second half of 2024.
We also think the likelihood of a recession across major economies has come down. We say this because the manufacturing sector that underpins these economies has witnessed a surprising turnaround. The S&P Global Manufacturing Purchasing Managers’ Index (PMI), which flashed red throughout 2022 and for most of 2023, has rebounded across the Euro zone, Canada and the U.S. despite high interest rates. Further, services sectors in these regions are showing signs of resilience.
Despite this recovery, we see a slowdown in economies that are more interest rate sensitive than the U.S. In the Euro zone and in Canada, labour markets and consumers are showing signs of strains due to elevated interest rates. Further, these economies haven’t seen the same level of fiscal spending as the U.S., where budget deficit as a percentage of gross domestic product (GDP) has hovered over 6%. Given this situation, we think central banks in Europe and Canada could cut interest rates ahead of the Fed. We also expect the relative interest rate differential between the U.S. and the rest of the world to further strengthen the U.S. dollar.
As for our tactical positioning, we are moderately overweight equities. We are cautiously optimistic about emerging market equities thanks to a rebound in commodity prices. We also see attractive valuations in China as the country emerges from 18 months of deflation. We are neutral towards both Canadian and U.S. equities. We also turned underweight Canadian investment grade bonds to reduce the overall duration of our bond portfolios. As well, we eliminated our underweight position to global high-yield (HY) bonds and turned neutral as they face less refinancing risks in the coming months.


